Results and deployment
This chapter describes the results achieved with the new architecture and software for high-speed network traffic processing (FETA module). The new FETA module was integrated into the original FETA probe firmware, which now has two main variants: (i) a probe with a single 400G Ethernet interface and (ii) a probe containing two 100G Ethernet interfaces. The 400G variant of the probe can be built using the Reflex CES XpressSX AGI-FH400G card, and the 2x100G probe can be built on top of the Silicom N6010 card.
The entire FPGA firmware, including the newly designed and implemented FETA module, was written in VHDL 2008. Synthesis and implementation for the target FPGA cards were performed using Intel Quartus Prime Pro 22.4. The firmware was tested using functional verifications. The entire probe, including the connection to the ipfixprobe SW, was tested using HW tests using the FlowTest tool 1. Subsequently, the probe in the 2x100G variant was deployed at a measurement point in the CESNET3 network.
FPGA resource usage
Table 1 shows the FPGA resource consumption after implementing the main components of the 400G probe after integrating the FETA module (architecture). The total resource usage is shown in percentages relative to the size of the target FPGA chip (AGIB027R29A1E2VR0). The most resource-intensive component is the Data Export component, which implements most of the packet operations on the 2048b wide data bus (inserting metadata, trimming the packet length, working with exports, and more). The packet filter is particularly demanding on a large number of Memory ALM blocks, where the filter rules are stored. Other components that take up a significant portion of the resources include the Packet Analyser and the FETA Acceleration Module (FAM).
| Component | Total ALMs | Memory ALMs | Flip Flops | M20K (BRAM) |
|---|---|---|---|---|
| Packet Analyser | 31,970 (3.5%) | 2,700 | 45,735 | 2 (0.0%) |
| RSS | 5,905 (0.6%) | 0 | 12,906 | 5 (0.0%) |
| Flow Hash | 7,375 (0.8%) | 0 | 0 | 0 (0.0%) |
| FAM | 30,759 (3.4%) | 8,500 | 67,145 | 545 (4.1%) |
| Packet Filter | 42,056 (4.6%) | 21,150 | 5,981 | 4 (0.0%) |
| Packet FIFO | 1,100 (0.1%) | 0 | 6,349 | 420 (3.2%) |
| Data Export | 93,889 (10.3%) | 7,460 | 96,614 | 287 (0.14%) |
| Total | 213,054 (23.3%) | 39,810 | 234,730 (6.4%) | 1,263 (9.5%) |
Table 1: FPGA resource consumption of the main components of the 400G probe.
The following Table 2 shows the FPGA resource consumption after implementing the entire FETA probe, including the DMA controller and other necessary parts of the NDK platform. The total resource usage is shown in percentages relative to the target FPGA chip size.
| Firmware | Total ALMs | Memory ALMs | Flip Flops | M20K (BRAM) |
|---|---|---|---|---|
| 400G probe | 600,424 (65.8%) | 72,060 | 848,081 (23.2%) | 3,988 (30.0%) |
| 2x100G probe | 288,739 (59.3%) | 41,200 | 541,616 (27.8%) | 2,600 (36.6%) |
Table 2: FPGA resource consumption of two variants of the entire FPGA probe firmware.
The 400G probe variant was implemented for the Reflex CES XpressSX AGI-FH400G FPGA card with the Intel Agilex 7 AGIB027 FPGA chip (AGIB027R29A1E2VR0). The 2x100G probe variant was implemented for the Silicom N6010 FPGA card with the Intel Agilex 7 AGFB014 FPGA chip (AGFB014R24A2E2V). In both cases, a significant portion of the resources (less than ⅔ of the ALM for the 400G probe) is consumed by the NDK platform itself, especially the DMA controller. In order for the FPGA probe to support higher speeds, it must internally use wider data buses (2048b@200MHz for 400G Ethernet). The complexity of the logic for processing network traffic increases with the data width and the number of packets per clock, so the resource consumption of a 400G probe is more than 2x greater than that of a 2x100G probe.
Figure 1 was obtained using the Intel Quartus Prime Pro tool and graphically shows the utilization of the FPGA chip after implementing the entire FETA firmware of the 400G probe. Although approximately 66% of the ALM blocks are used, they are spread over almost the entire area of the chip. The light blue part implements 400G Ethernet support, the red area is used for the actual processing of network packets (probe components: Packet Analyser, FAM, Packet Filter, Data Export, etc.), the purple area implements the DMA controller, and the green areas implement support for two PCIe Gen4 x16 endpoints.
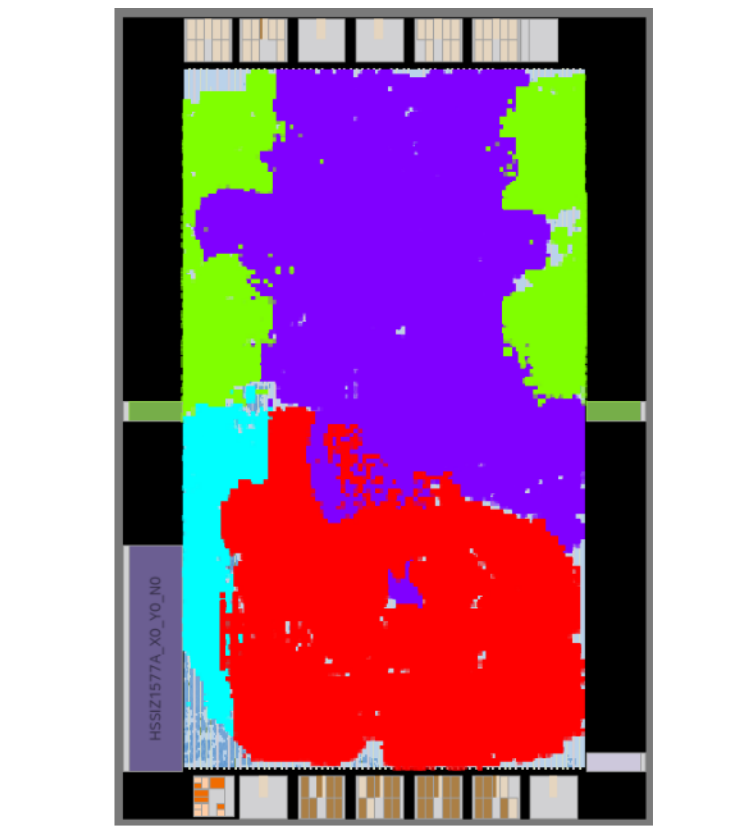 Figure 1: Utilization of the Intel Agilex FPGA chip with the FETA firmware of the 400G probe.
Performance of CTT module
When testing the performance of the created CTT module, we focused on analyzing the behavior in realistic network traffic. For this, we used the FlowTest tool, which allows generating a network profile according to various network profiles. We used the following network profiles that are part of the FlowTest tool:
- GEANT, Afternoon Dropoff (G_AD)
- GEANT, Morning Rise in traffic (G_MR)
- GEANT, Spike in traffic (G_S)
- NIX, Afternoon Dropoff (N_AD)
- NIX, Morning traffic (N_M)
- NIX, Night Low traffic (N_NL)
- NIX, Workday Peak (N_WP)
The GEANT network is typical for transmitting a large amount of scientific data, so there are rather large packets and a smaller number of heavy flows. On the contrary, the NIX network has the character of a regular commercial network, so there are rather smaller packets and more light network flows. The FlowTest tool allows you to modify the average length of generated packets. Two network profiles were used for the measurements:
- DefaultPackets = original packet lengths (GEANT ~1100B, NIX ~480B)
- SmallPackets = shortened packet lengths (GEANT/NIX ~140B)
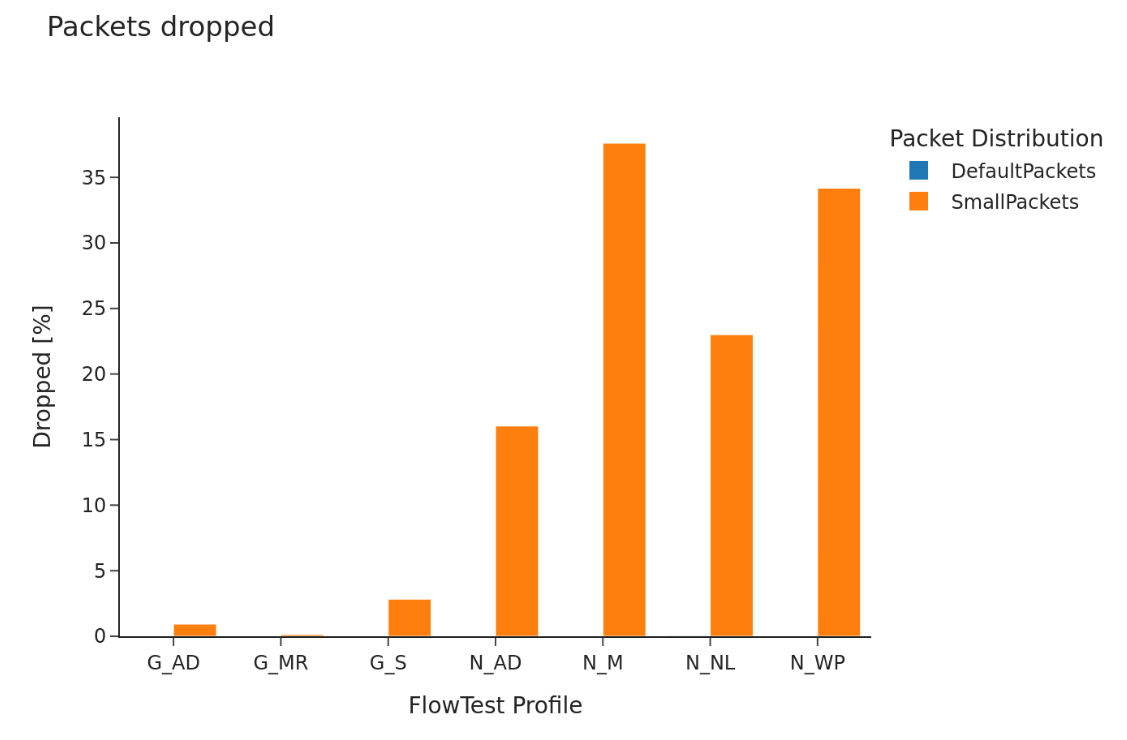 Figure 2: Drop rate of 400G CTT module.
Figure 2 shows the drop rate of the CTT module for individual tested network traffic profiles. CTT handles all profiles while maintaining the original packet lengths without dropping. Only if we modify the packet lengths to be significantly smaller (the packet rate increases), the CTT module stops catching up and in NIX profiles with a high number of network flows, dropping occurs. In GEANT profiles, there is no dropping, here the caching system works well with a smaller number of heavy flows.
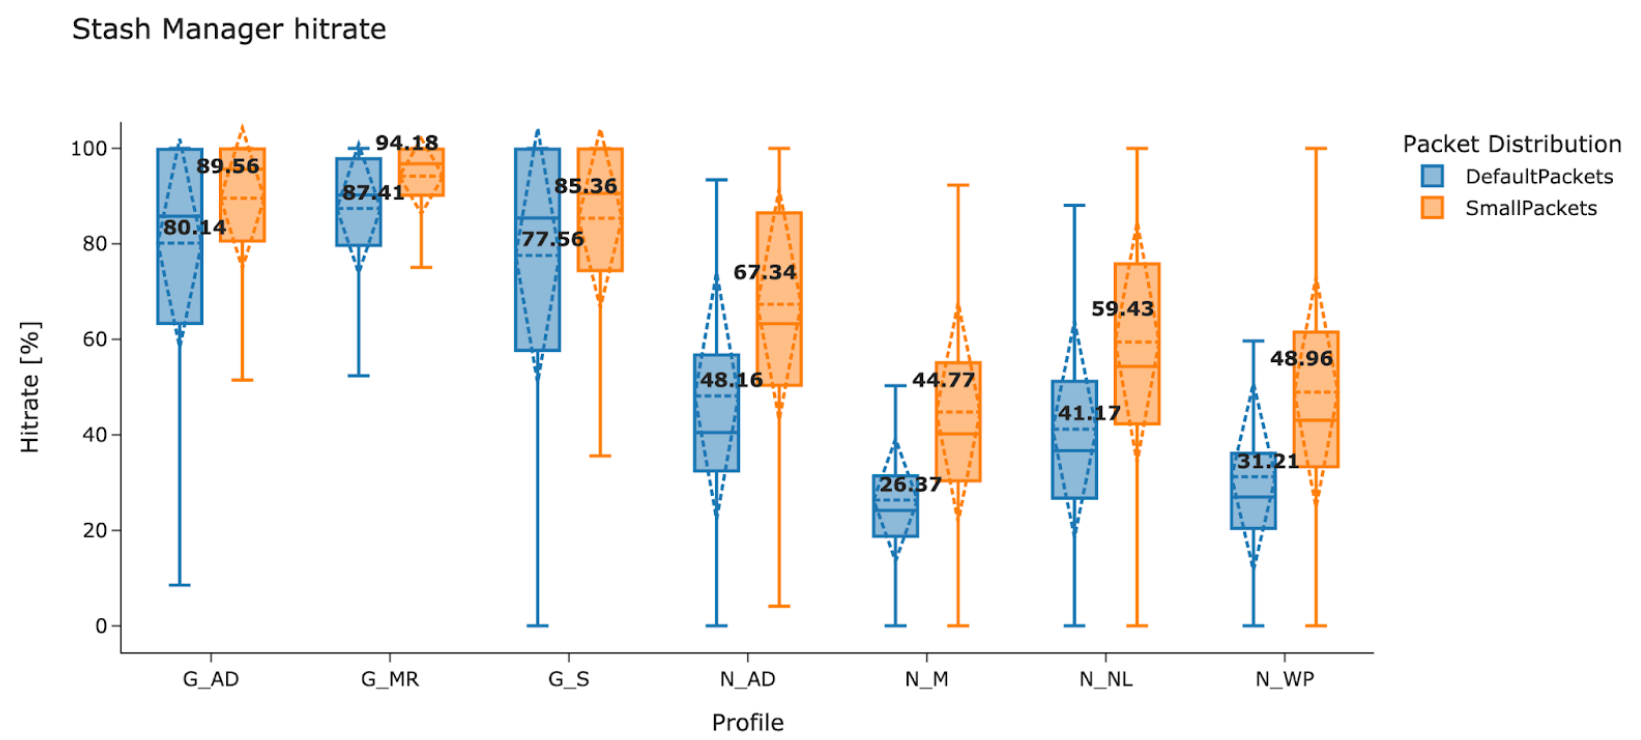 Figure 3: Hit rate of 400G CTT module Stash Manager (also referred to as Flow State Manager).
The good functioning of the caching system is confirmed by Figure 3, which shows the average hit rate achieved for the tested profiles. The average hit rate for GEANT profiles is approximately 80%, for profiles from the NIX network the hit rate is lower, due to the larger number of unique network flows it is approximately 40%.
 Figure 4: Latency of 400G CTT module.
The average latency of the CTT module is strongly influenced by the latency of the DRAM memories used. The results of the performed CTT module latency measurement are shown in Figure 4. In the case when there is no significant slowdown of the CTT module, the latency on average ranges from 0.5 to 1.5 μs. However, if the external DRAM memories stop catching up (even with caching), it can have a very negative impact on the latency, which can then reach the 40 μs mark in the worst cases.
Deploying a probe in the CESNET3 network
The monitoring FPGA probe with the FETA module was deployed together with ipfixprobe at a test measurement point in the CESNET3 network. For this deployment, a 2x100G probe implemented on a Silicom N6010 card was used. This long-term deployment in a real environment verified the stability and functionality of the prepared solution. At the same time, the expected benefits of ipfixprobe acceleration using CTT in the FPGA card were confirmed. For a specific comparison, we present Table 3 with the number of dropped packets for the “GEANT Morning” network profile, which is characterized by a low number of heavy flows. In such a case, the ipfixprobe probe with acceleration turned off does not catch up and drops packets, on the contrary, with acceleration using CTT turned on, packet dropping practically stops.
| Acceleration | Packets (processed / total) | Bytes (processed / total) | Packet drop rate |
|---|---|---|---|
| CTT ENABLE | 1421412040 / 1421501280 | 1639166631668 / 1639289910680 | 0.01% |
| CTT DISABLE | 1348058442 / 1421501280 | 1540467652756 / 1639289910680 | 5.17 % |
Table 3: Number of dropped packets with ipfixprobe acceleration enabled and disabled.
References
-
CESNET, FlowTest GitHub repository, https://github.com/CESNET/FlowTest. ↩